
Analysing the raw video signal of the Philips P2000M
Introduction
The video connector on the Philips P2000M exposes the signals used to build its 80-column monochrome display, but their relationship is not immediately obvious from the waveforms alone. In this blogpost, I determine how the screen is encoded by combining the dot, character, and row timing in the P2000M service manual with simultaneous oscilloscope measurements of the video, horizontal-sync, and vertical-sync outputs.
By aligning the measured transitions with the manual’s counters, the complete raster can be mapped, the visible window identified, and the original screen reconstructed dot by dot. The result is a proprietary monochrome raster signal that is much closer to the machine’s internal timing than to a modern, ready-to-display monitor signal. It is not standard PAL composite video, VGA, MDA, or CGA, although its line timing is closely related to the 15.625 kHz line frequency used by European 625-line television systems.
The connector carries separate horizontal sync, vertical sync, and one-bit video signals rather than a composite waveform. It does not expose the 12 MHz dot clock, so a receiver must recover the raster from the sync signals and determine where the video samples fall on the source dot grid.
The raw analysis files and scripts are available in the p2000m-video-signal-analysis repository.
Capturing the signal
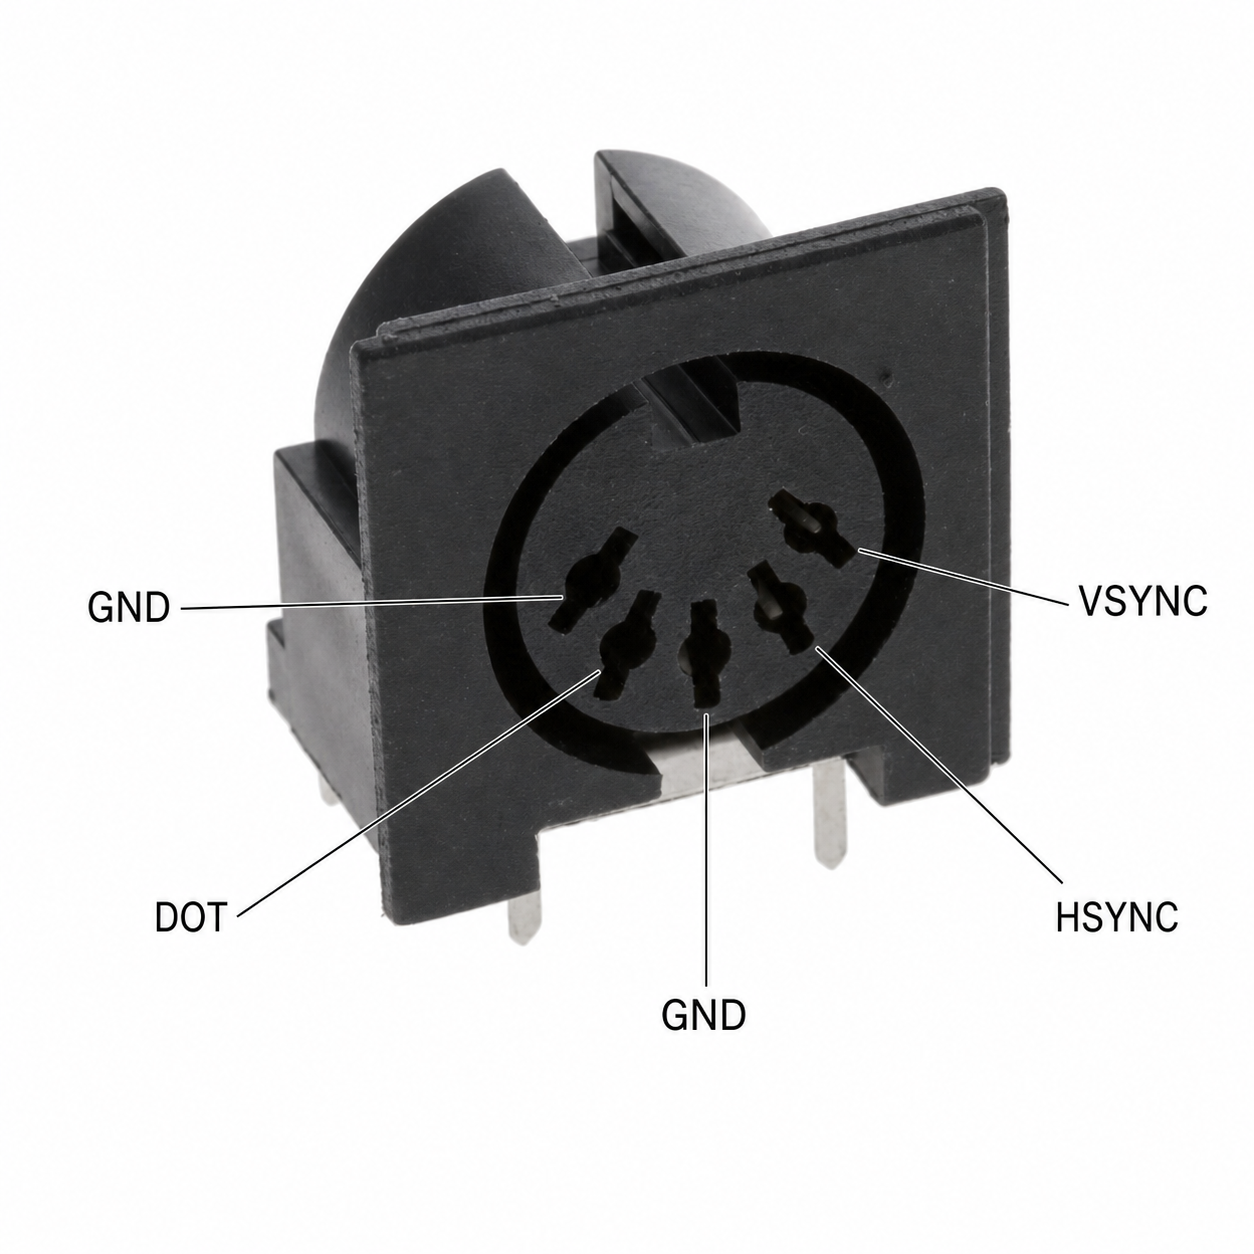
The video connector on the P2000M is a typical 180-degree DIN 5 socket. Looking into the female socket from the mating side, with the keying notch at the top and the central contact (pin 2) downwards, the socket positions can be read from left to right as:
- Pin 3:
VSYNC - Pin 5:
HSYNC - Pin 2:
GND - Pin 4:
DOT/SIGNAL - Pin 1:
GND
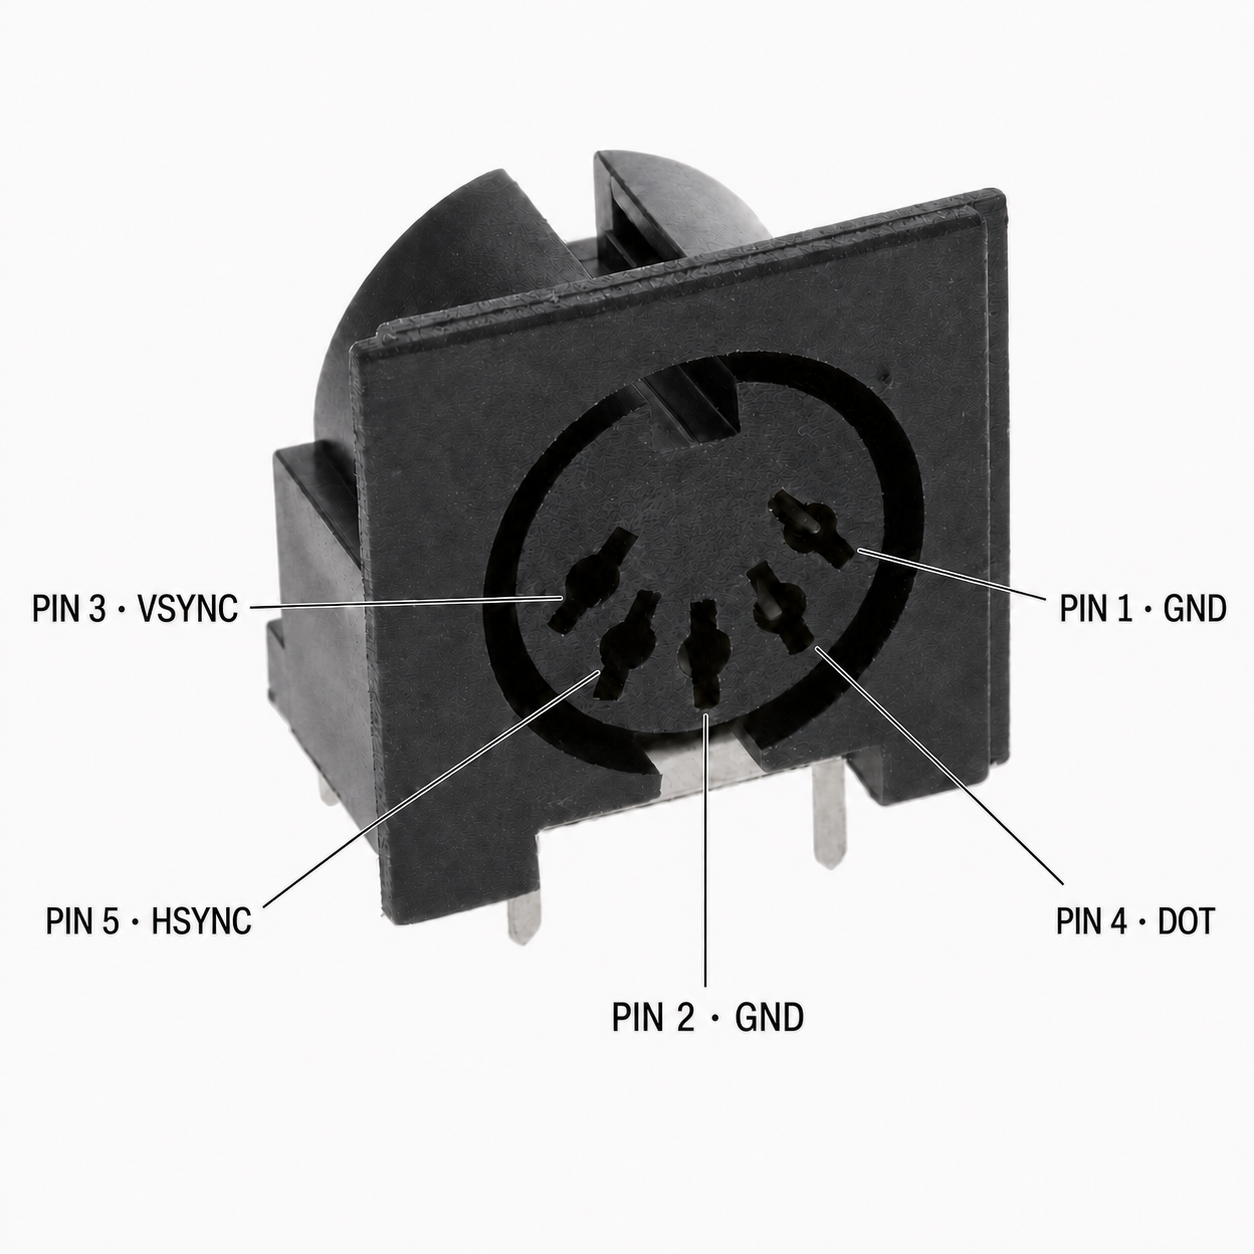
This agrees with section 3.8.10 on page 3-32 of the
P2000M/T Field Support Manual.
The manual calls the signals on pins 1 and 2 L; on this machine both contacts
are ground.
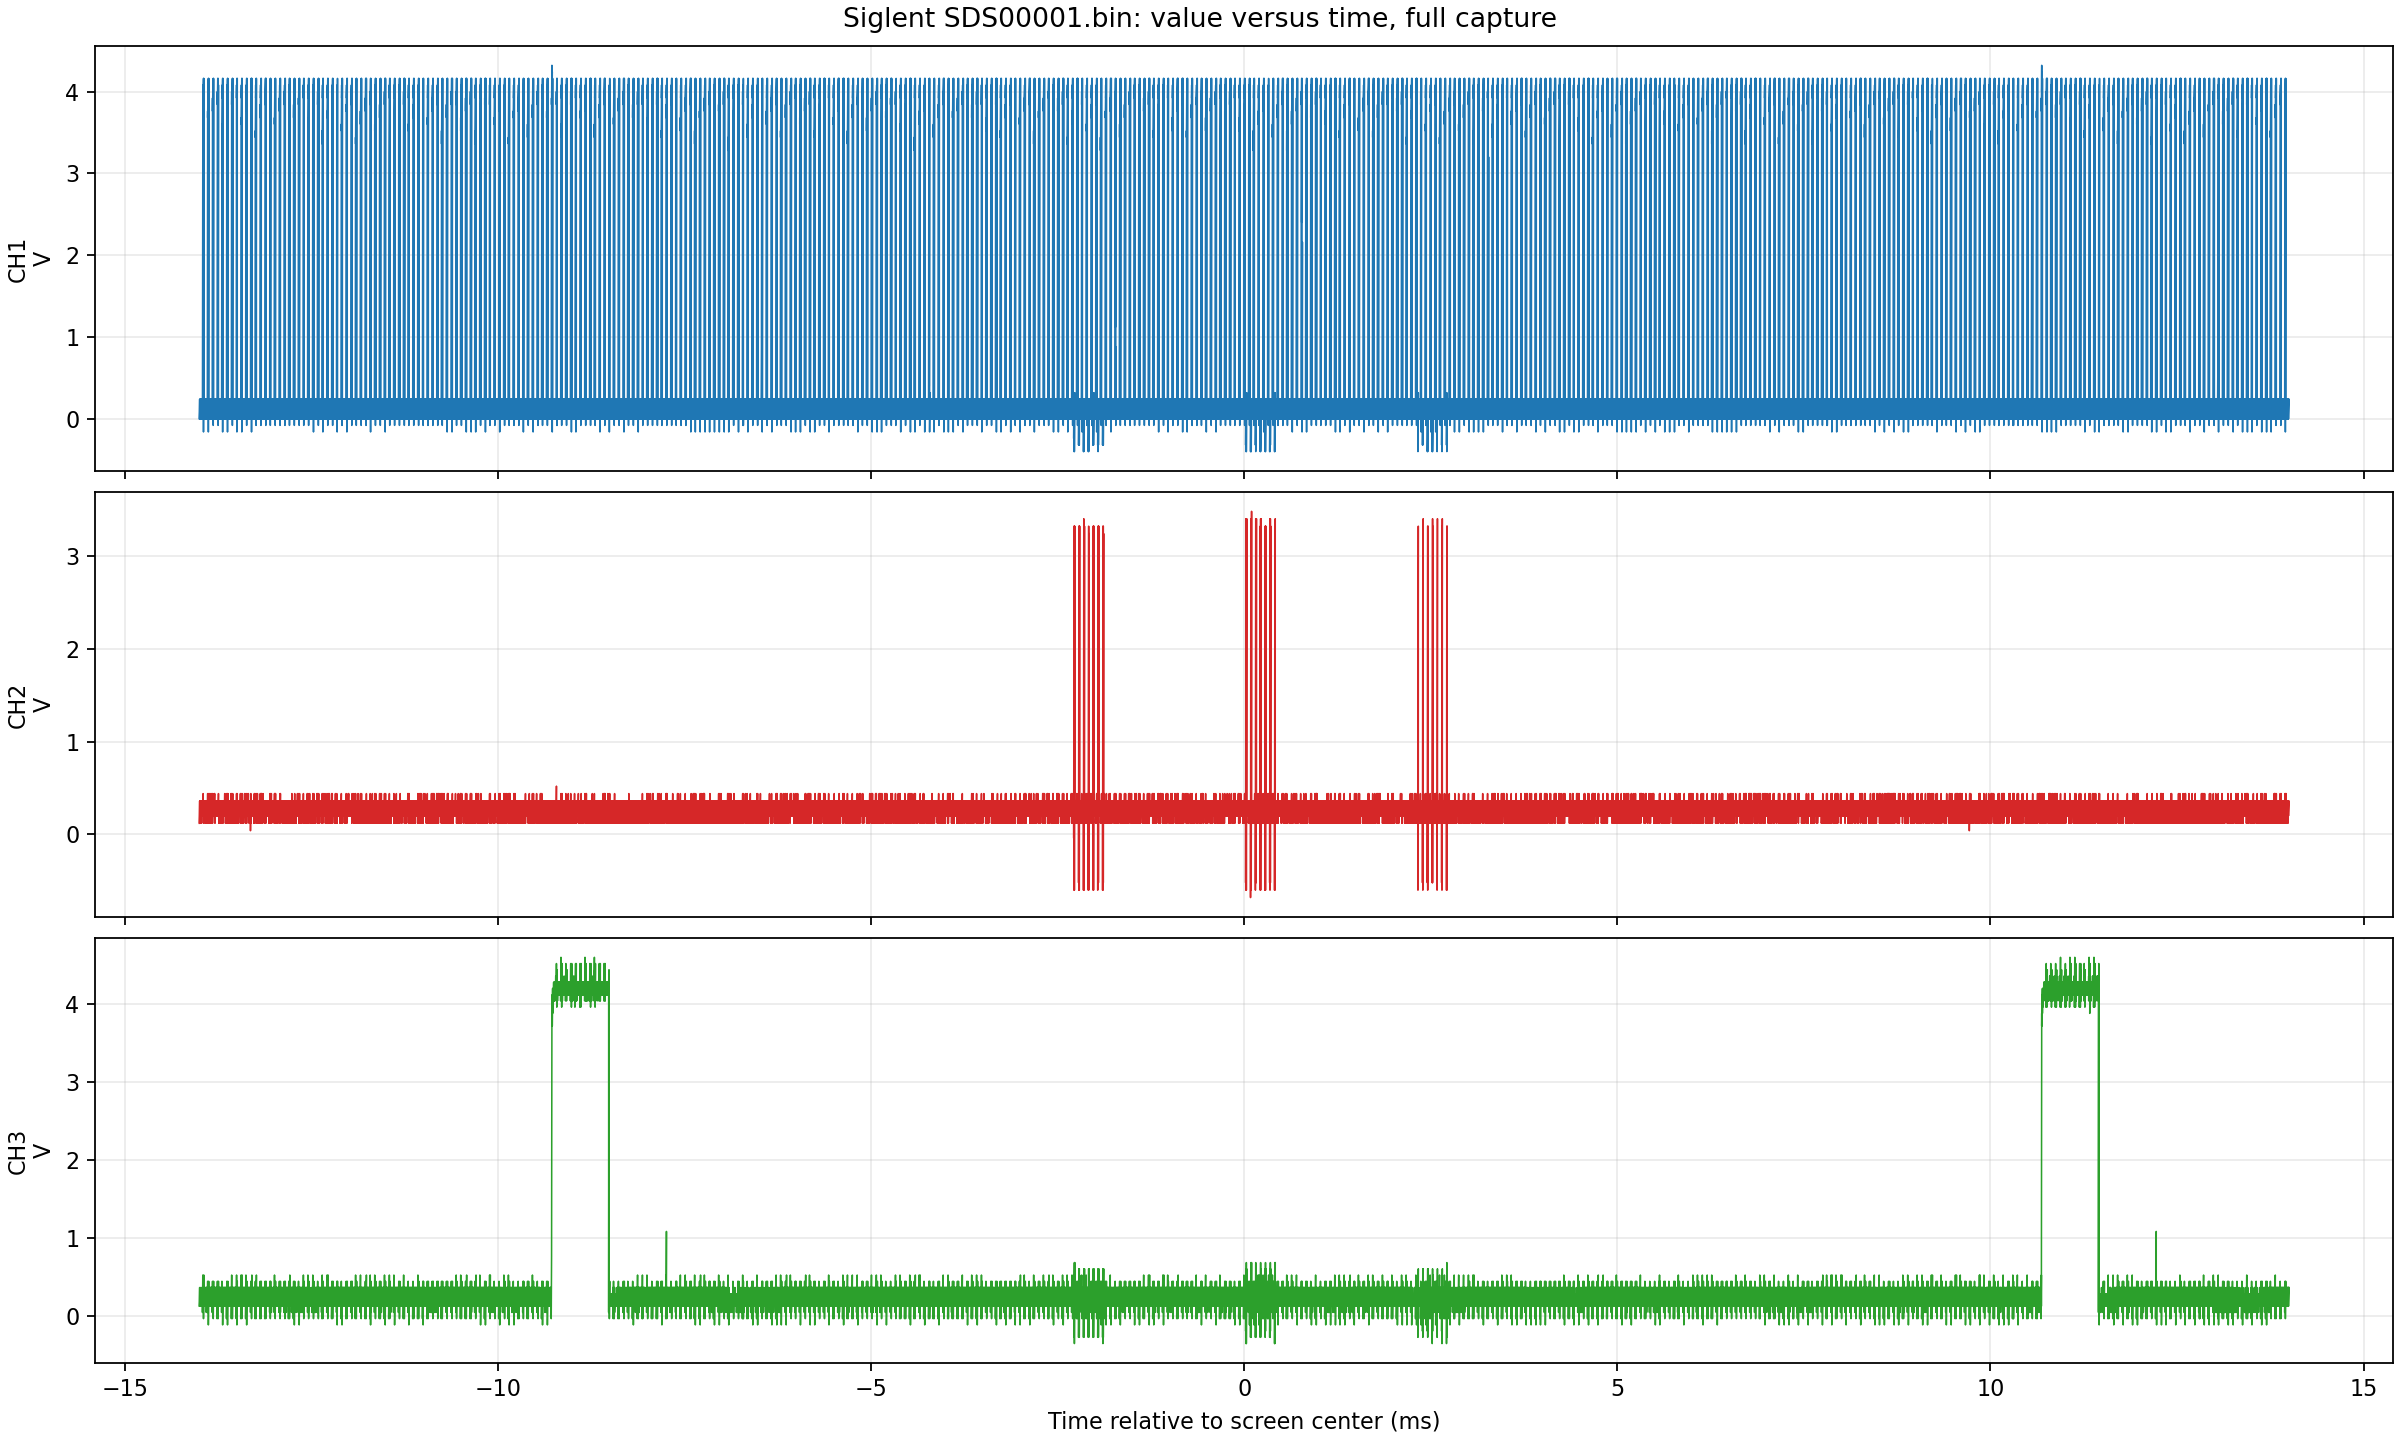
For the waveform analysis I used a Siglent oscilloscope capture with three channels:
CH1: horizontal syncCH2: monochrome video levelCH3: vertical sync
The capture is stored as a binary waveform file and then decoded with small Python scripts. The scripts convert the oscilloscope samples back into voltages, detect the sync edges, and align the waveform with the P2000M video timing from the service manual.
Electrically, the VIDEO line is an analog voltage waveform, but the picture
information it carries is binary: each source dot is either foreground or
background. Applying a voltage threshold to the measured waveform is therefore
enough to recover the monochrome dot values once their timing positions are
known.
Reconstructing the frame
The useful part of the timing is the familiar text-mode geometry: 80 characters by 24 visible rows, with an 8 by 12 dot character cell. The character generator therefore produces a 640 x 288 active monochrome image:
80 characters x 8 dots      = 640 visible dots
24 character rows x 12 lines = 288 visible lines
Internally, the timing is larger than the visible area. The dot clock is 12 MHz, so one dot period is approximately 83.33 ns. A complete horizontal line contains 96 character times, or 768 dot-clock periods:
96 characters x 8 dots = 768 total dots per line
12,000,000 / 768       = 15,625 Hz
This gives a horizontal line period of 64 us and a line frequency of 15.625 kHz. The 640-dot active part lasts approximately 53.33 us. Of the 96 character periods, 80 carry picture data and the remaining 16 are used for horizontal blanking and synchronization.
Vertically, a complete frame contains 26 character rows, with 12 scanlines per row:
26 rows x 12 scanlines = 312 total lines per frame
24 rows x 12 scanlines = 288 visible lines
15,625 / 312           = 50.080 Hz
The complete raster is therefore 768 x 312 timing positions, with a 640 x 288 active image area. The ideal clock-derived frame rate is about 50.080 Hz; the measured source is approximately 50.095 Hz. The signal is progressive rather than interlaced, so it can be described as a 312-line, approximately 50.1 Hz progressive monochrome format with PAL-family line timing.
Vertical row order
The 24 rows in video memory map to hardware timing rows R01 through R24.
Rows R25 and R00 form the vertical blanking and row-preparation interval.
An important detail is that VSYNC is asserted during R24, the final visible
hardware row, rather than entirely during the two blank rows:
R24  video-memory row 23; VSYNC asserted
R25  vertical blanking
R00  vertical blanking and row preparation
R01  video-memory row 0; visible capture starts
 ...
R24  video-memory row 23; visible capture ends
The end of VSYNC therefore marks the start of R25, not the start of R00
or R01. From that point, 24 horizontal-sync intervals must pass to skip the
12 scanlines of R25 and the 12 scanlines of R00. The following 288
scanlines are exactly hardware rows R01 through R24. Starting visible
capture directly at a VSYNC edge would include a blank character row and omit
the last row of the screen.
Recovering the dot grid
Because the connector does not provide the source dot clock, the video cannot reliably be decoded by simply sampling at a nominal 12 MHz. The sampling clock will generally have an arbitrary phase and a small frequency difference with respect to the P2000M.
A robust reconstruction anchors every scanline independently to an HSYNC
edge, waits until just before the active picture, and oversamples the video for
slightly more than the nominal 53.33 us active interval. Resynchronizing on
every line prevents a small horizontal timing error from accumulating down the
frame.
The effective source dot period can be derived from the measured frame period using the known geometry of 312 lines and 768 dot positions per line. The 640 visible output dots can then be mapped onto the oversampled input. Testing a few nearby horizontal phases and selecting the one with the strongest foreground response compensates for the unknown phase relationship. Examining several adjacent samples for each reconstructed dot also helps preserve narrow character strokes without introducing grey interpolation pixels.
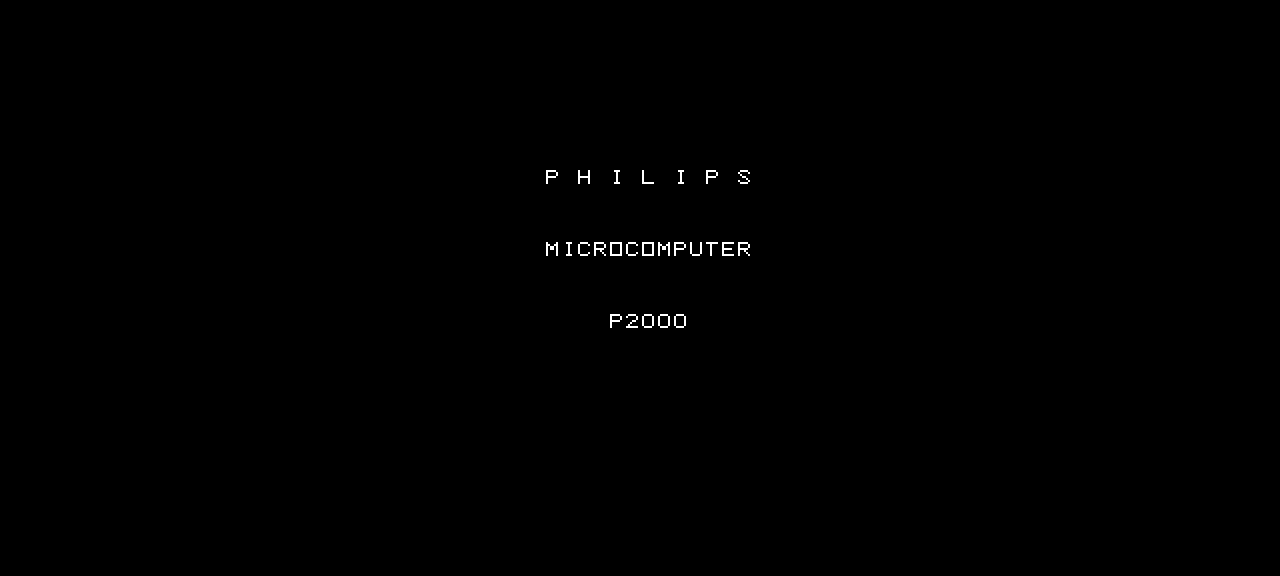
After the two blank hardware rows have been discarded, the natural decoded frame is a packed 640 x 288 one-bit bitmap, matching the 80 x 24 text display exactly.
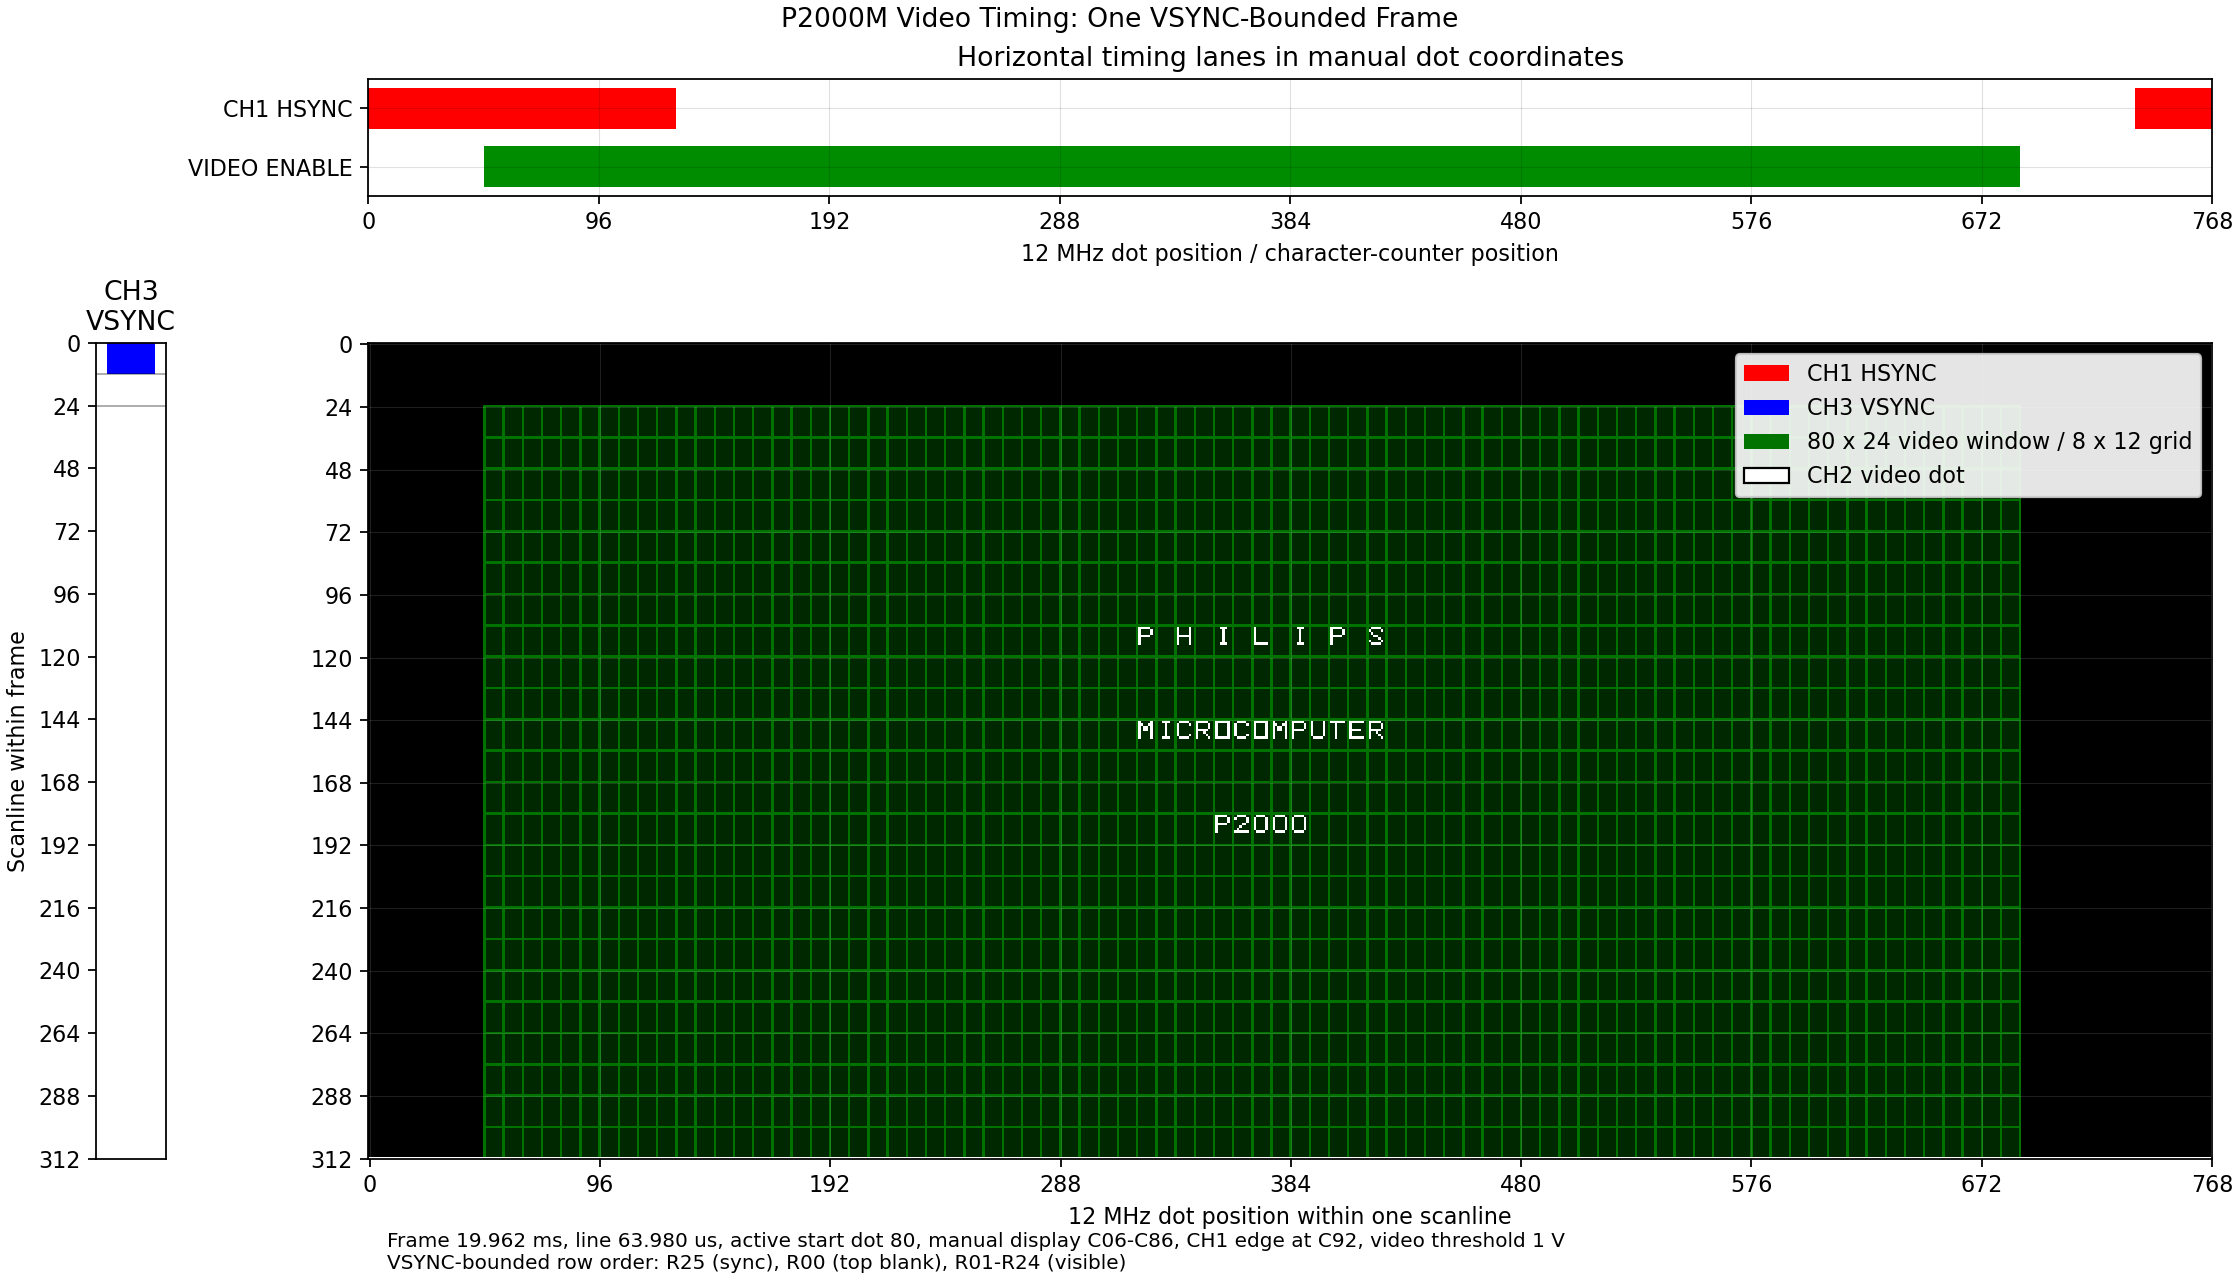
Timing map
The timing diagram combines the measured signals with the service manual’s dot,
character, and row counters. Its frame begins when raw VSYNC is deasserted at
the start of R25, which is the correct reference for the visible capture.
The first 24 scanlines are the blank rows R25 and R00; the green 80 by 24
display window then covers R01 through R24. White dots are video samples
above the chosen threshold, red marks horizontal sync, and blue marks vertical
sync. The blue interval consequently appears across the final 12 visible
scanlines, because VSYNC is asserted during R24.
This makes the raw nature of the port very clear: the display information is there, but a receiver or display interface still has to respect the machine’s separate sync and blanking structure.
Practical implications
The P2000M signal is regular and fully reconstructable, but it is not directly compatible with a modern monitor. Its 15.625 kHz line rate, approximately 50.095 Hz frame rate, one-bit video, and separate synchronization require the source image to be captured and a new display raster to be generated.
When the source and destination refresh rates are asynchronous, completed source frames should be exchanged only at destination frame boundaries. The newest source frame can be repeated when necessary; changing buffers mid-frame would combine two source frames and produce a visible tear. Horizontally, the 640 recovered source dots can map one-to-one to a 640-pixel output. Any vertical expansion of the 288 source lines is best performed with nearest-neighbour line repetition so the hard monochrome character edges remain intact.